
GBP/USD Price Forecast: Holds Descending Triangle breakout
- GBP/USD ticks lower to near 1.3500 as the US Dollar edges up.
- Traders have trimmed hawkish Fed bets after weak US NFP data for July.
- Investors await the US CPI and the UK GDP data.
The GBP/USD pair trades marginally lower at around 1.3500 during the European trading session on Tuesday. The Cable edges down as the US Dollar (USD) ticks up; however, financial markets doubt the slight recovery move seen this week, with traders paring hawkish Federal Reserve (Fed) bets for the September policy meeting due to weak United States (US) Nonfarm Payrolls (NFP) data for July.
US payrolls stumble as July jobs data disappoints
Economists at ING describe the July US jobs report as "surprisingly weak," noting that nonfarm payrolls "fell 23k" on the month. They highlight that the softness was compounded by "103K of downward revisions to the past two months' data," which has dragged the "3M average" gain in payrolls down to just "20,000." ING argues that this combination of an outright monthly decline and sizeable revisions paints a notably softer picture of underlying labour market momentum.
According to the CME FedWatch tool, the odds of the Fed holding interest rates steady in the September meeting have increased to 50% from 30.4% seen a month ago.
Going forward, investors will focus on the US Consumer Price Index (CPI) data for July and the United Kingdom (UK) Q2 and June Gross Domestic Product (GDP) data, which will be released on Wednesday and Thursday, respectively.
GBP/USD Technical Analysis
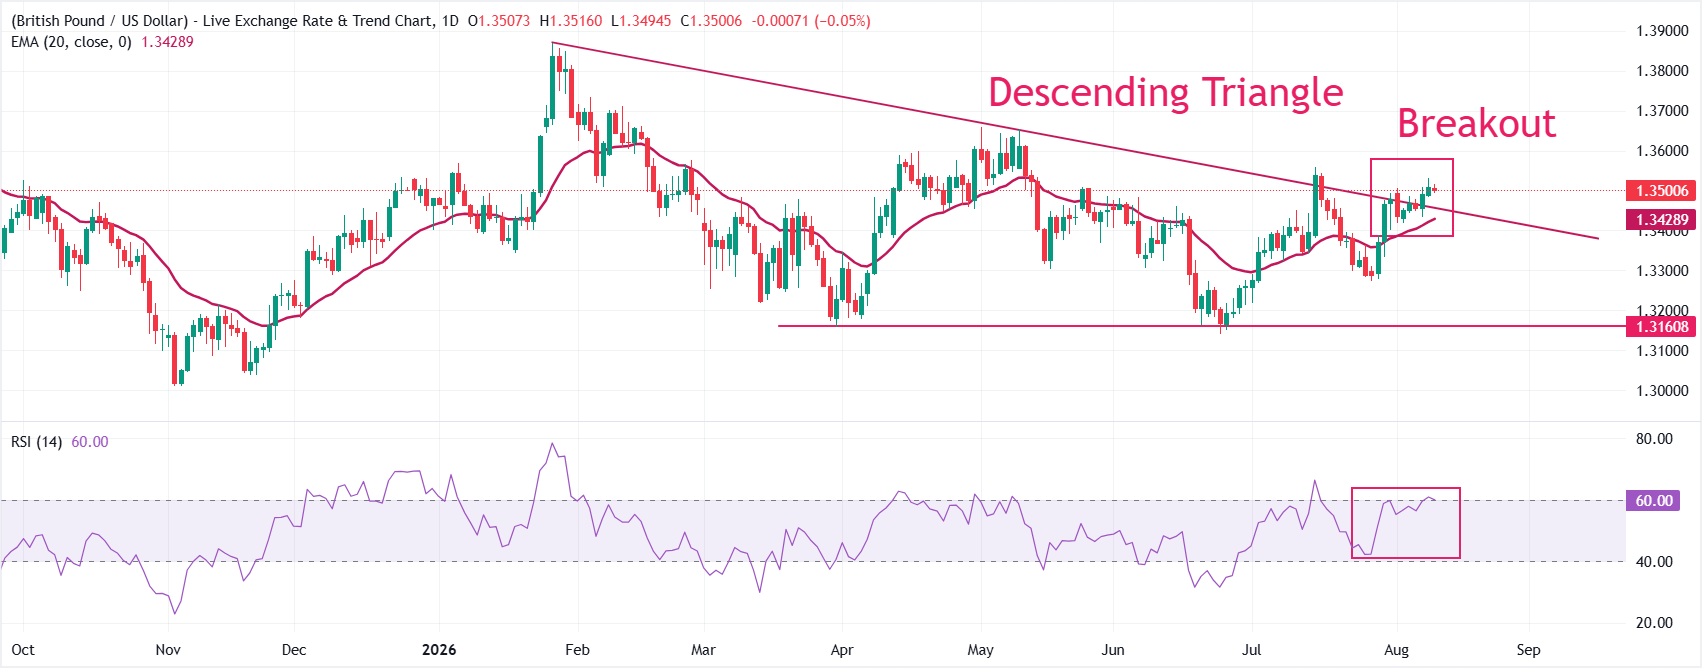
GBP/USD trades around 1.3501, holding a bullish near‑term bias as spot remains above the 20-period exponential moving average (EMA) at 1.3429 and the downward-sloping border of the Descending Triangle pattern offering support near 1.3455.
The pair is thus supported by both dynamic and structural levels, while the Relative Strength Index (14) at about 60 points to firm but not overextended bullish momentum, suggesting buyers still control the near-term direction.
On the downside, initial support is seen at the former resistance trend line turned floor around 1.3455, followed by the 20-period EMA at 1.3429, where dip buyers may re-emerge if corrective pressure unfolds. Looking up, the pair could advance towards 1.3600 if it manages to extend the advance sustainably above the July 15 high at 1.3558.
(The technical analysis of this story was written with the help of an AI tool. Know more.)
Economic Indicator
Consumer Price Index (YoY)
Inflationary or deflationary tendencies are measured by periodically summing the prices of a basket of representative goods and services and presenting the data as The Consumer Price Index (CPI). CPI data is compiled on a monthly basis and released by the US Department of Labor Statistics. The YoY reading compares the prices of goods in the reference month to the same month a year earlier.The CPI is a key indicator to measure inflation and changes in purchasing trends. Generally speaking, a high reading is seen as bullish for the US Dollar (USD), while a low reading is seen as bearish.
Read more.Next release: Wed Aug 12, 2026 12:30
Frequency: Monthly
Consensus: 3.4%
Previous: 3.5%
Source: US Bureau of Labor Statistics
The US Federal Reserve (Fed) has a dual mandate of maintaining price stability and maximum employment. According to such mandate, inflation should be at around 2% YoY and has become the weakest pillar of the central bank’s directive ever since the world suffered a pandemic, which extends to these days. Price pressures keep rising amid supply-chain issues and bottlenecks, with the Consumer Price Index (CPI) hanging at multi-decade highs. The Fed has already taken measures to tame inflation and is expected to maintain an aggressive stance in the foreseeable future.